How to Use Lumo's Dashboard For Managing and Monitoring Irrigations
Overview
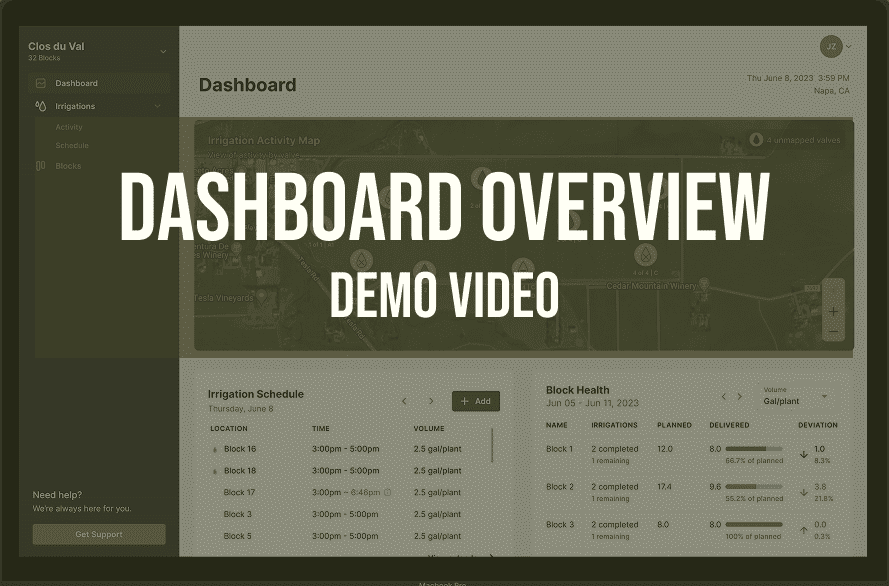
The Lumo Ops Center Dashboard gives you full control of your irrigation system — from automation to real-time monitoring and performance management.
In this video, you’ll learn how to:
-
Automate your irrigation schedules effortlessly
-
Monitor flow rates and valve statuses in real time
-
Manage irrigation events based on crop needs
-
Analyze irrigation performance to improve efficiency
Key Benefits of Lumo's Precision Irrigation Technology:
-
Irrigation Automation: Save time and resources with scheduled, intelligent watering.
-
Irrigation Monitoring and Control: Stay informed with live updates on system health and performance.
-
Irrigation Management: Make data-driven decisions that boost yield and minimize water waste.
-
Irrigation Performance Tracking: Gain insights into system usage to maximize ROI.
Want to see Lumo in action? Request a demo or email us at [email protected]
Video Transcription
Let's take a quick tour of the op center dashboard. The first widget here is an activity map. It's showing the current irrigation activity ongoing on the ranch. Each droplet indicates a device in most cases. These are valves. They may also indicate a relay or the base unit when the valve is closed or not irrigating. These droplets have an X through the center.
If the valve is open or irrigating, it will have a solid fill droplet red for an irregular irrigation or green for a normal irrigation. You can hover over each icon and it'll give you the current or most recent and upcoming status. You can also open a link to the valve or device in Google Maps. The next widget on this dashboard is our irrigation schedules. This is designed for a quick glance at your daily schedule of whichever day you have selected. It'll default to today's schedule. You can schedule an irrigation from the dashboard by clicking the add button at the top right corner of the irrigation schedules widget. Next we have the block summary. This is giving you an overview of all water delivered in the week that you have selected. Again, this defaults to the current week. Here we can see if we look at block F two, for example, we've completed one irrigation. We have no further irrigation remaining on the schedule. We planned 6.37 gallons per plant and delivered 11.71 gallons per plant. In other words, we over watered by 183.87%.
The red progress bar here indicates an irregular irrigation, which means that the volume was plus or minus 10% of the expected volume. The widget also indicates deviation from the expected or planned volume. In this case, we overwatered by 5.34 gallons or 83.87%. When an irrigation is normal, in other words, within 10% of the expected volume, we show that progress bar in green. The final widget on the dashboard is our irrigation activity. Here we're showing each irrigation event in chronological order separated by block. From this widget, you can see what time the irrigation started its status as a regular or normal, the volume that was delivered versus planned, the flow rate versus the expected flow rate and the duration of the irrigation. When the smart baseline switch is toggled on the ops center will automatically pull out the irrigations that need our attention. In this case, we're looking at block E. If we click on that irrigation, we will open Lumo flow vision, where we'll see a play by play of this entire irrigation. Now we can see that this irrigation was below the expected flow rate and thus below the expected volume. The expected rate is the dotted line at about 62.97 gallons per minute. The actual rate was much closer to 53 gallons per minute. We can also look at these stats as we scroll down the page.
If we want to compare and see if this is a normal flow rate for this block, perhaps our emitter based rate is incorrect. We can hit the compare button and select a previous irrigation.