How to Use Lumo's Activity and Flow Vision Features
Overview
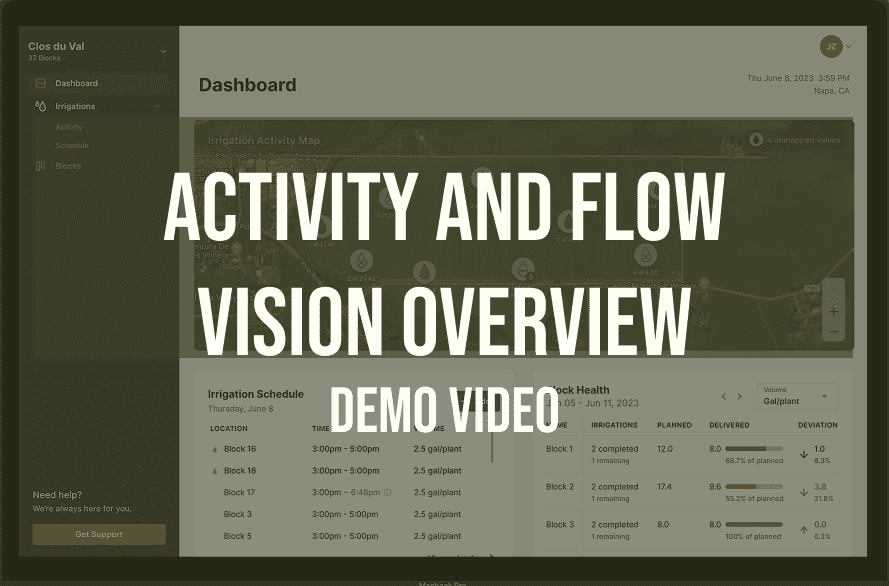
In this quick 3-minute video, you'll get a look at how the Lumo Ops Center makes precision irrigation easier and more effective. Whether you're trying to simplify irrigation automation or improve irrigation performance, our platform gives you the tools to monitor and control your system—right from your phone or computer.
Lumo helps growers like you use water more efficiently, reduce waste, and improve crop health through real-time irrigation monitoring and control. It’s designed to fit into your day-to-day, giving you the insights you need without the hassle.
What you’ll see in the video:
-
Real-time irrigation monitoring and control
-
Automated scheduling and flow adjustments
-
Data-driven tools to manage and improve irrigation performance
If you're looking to get more from your irrigation system—with less stress—Lumo can help. Learn how to take control with smarter irrigation management.
Want to see Lumo in action? Request a demo or email us at [email protected]
Video Transcription
To view all irrigation activity under irrigations on the sidebar, click the dropdown and navigate to the activity page. Here you can custom select a date range. In this case, we are looking at the first week of October, 2024. Within this selected date range, you can search by block. You can also sort by irrigations that are currently in progress. Those that are already completed, scheduled or upcoming, or by flagged irrigations flagging an irrigation is a useful tool. If there's something you need to review later, for example, we can flag this irrigation on block F1, and when we sort by flagged irrigations, it'll pull up that flagged irrigation. We can save this for later. Come back and review it another time.
You can click on each individual irrigation, which will open up Lumo flow Vision. Flow vision displays every flow rate data point collected during the course of an irrigation. It's normal to see a spike at the beginning of the irrigation. When pressure is built up against a valve, the valve opens releasing all that water. When the lines fill the system. Equalizes flow stabilizes in this case around 18 gallons per minute. The expected flow rate here is displayed by the dotted line. You can scroll down to view more details about the irrigation, including the actual verse expected volume flow rates over the course of the irrigation and its duration. You can also add notes to this irrigation if you wanna review them later. You can view the total volume of this irrigation by clicking the dropdown arrow and click total. You can also compare this irrigation to previous irrigations of this block. This is useful if we wanna determine if this irrigation flow rate was irregular as it's indicated here, or if it might be normal and perhaps our emitter based rate is incorrect from the dropdown. We can select a past irrigation on this block. Selecting another irregular status here, and we can see that in this previous irrigation, the flow rate was also about 18 gallons per minute. We're starting to get a sense that the theoretical emitter based rate does not match the actual flow rate that we are measuring.