Precision in Action, Edition 3: What Good Looks Like
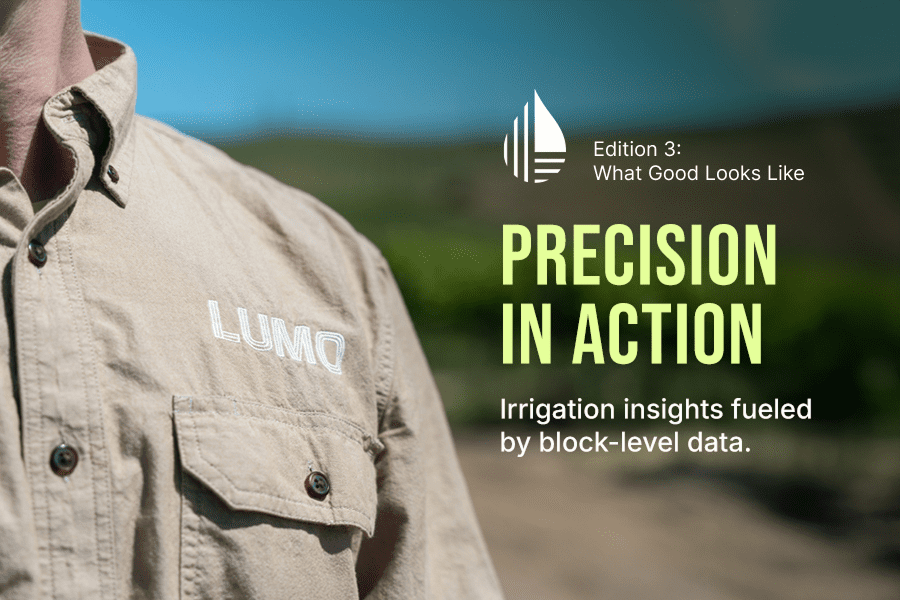
Precision in Action is a series where we share irrigation insights and grower wins from the field, fueled by Lumo’s block-level data. In this edition, we'll show you how Brian Pires is using flow data to figure out how best to schedule sets at Silver Oak’s Twomey West.
One key to improving performance in almost any pursuit is knowing what good looks like.
A good swing. A good shot. A good irrigation.
That’s what Brian Pires, the Vineyard and Grower Relations Assistant at Silver Oak, now has for all of his blocks at Twomey West, where he manages his irrigation sets using Lumo.
He knows what good looks like in terms of flow, pressure, and volume, and he knows when performance is suffering.
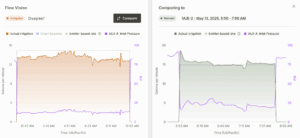
Pictured above is Lumo’s tool for comparing irrigations from the same block. On the right, you can see what a good irrigation looks like, where the flow rate is almost exactly in line with what’s expected (also known as the emitter-based rate). On the left, you see data from an irrigation where Brian scheduled three blocks at once. You can see the decline in pressure (from 25 PSI on the right to 12 PSI on the left) and the system struggling to achieve the expected flow rate.
“In the past I thought we could run three blocks at once. But after watching the data, I realized, one block everything’s fine, two blocks and all the numbers still look good, but turn on a third block and all of a sudden the flow rates drop below where they should be. So now I know, two is the optimal number to get the full irrigation volume on all our blocks,” said Brian.

Having objective, block-level data helps irrigators like Brian drive irrigation performance and increase precision. It gives them a picture of what good looks like, so they can clearly see when something’s off and they need to make adjustments.