5 Ways for Growers to Use Irrigation Flow Rate Data

Most growers don’t know exactly how much water is flowing through their irrigation systems. They lack visibility.
And that lack of visibility, more often than not, gets in the way of growing better crops, reducing unnecessary risks, and improving operational efficiency.
Here are five things that become possible for growers to do when they start measuring, monitoring, and capturing irrigation flow rate data on all their irrigations.
1. Move from duration to volume-based irrigation.
In the past, irrigations were based on time. Run the water for three hours, or six, or however long.
Today, growers are now able to irrigate based on volume. Using smart valves with built-in flow meters, it’s possible to specify the volume of water you want put on each block and then to know for certain that that amount was actually delivered.
Over time, you can dial in your precision because you’re able to accurately measure your water input and make adjustments accordingly. Flow rate data puts growers in control.
2. Automatically detect line leaks, clogged emitters, and any other faults.
When there’s an issue with your irrigation system, that gets reflected in flow rate data. If a line springs a leak, the actual flow deviates from what’s normally expected and from your past irrigations.
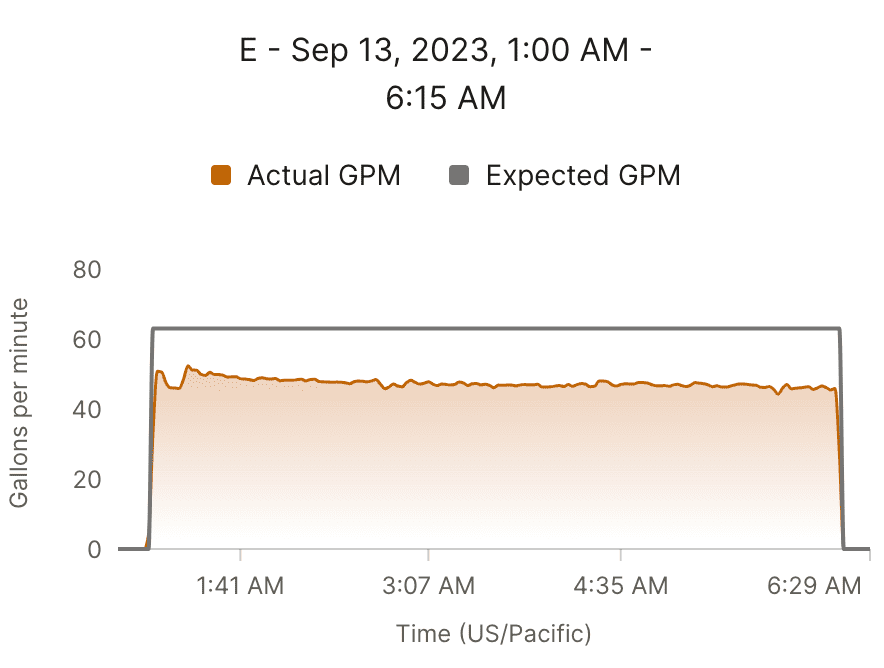
The data above shows the actual flow rate was much lower than the expected flow rate, which is typically reflective of clogged lines in need of maintenance
At Lumo, we’ve built our software to automatically notify growers when issues like this arise, so that they no longer have to spend countless hours walking through vineyard blocks looking for problems.
By visualizing this data on a graph and comparing it against expected or historical flow rates, we’ve made it easy for irrigators to pinpoint when the problem started and to get a jumpstart on diagnosing its cause.
With access to real-time flow rate data, growers are able to save a bunch of time by catching issues automatically and better protect their crops from catastrophic leaks by fixing them far sooner.
3. Engage in preventative maintenance on their irrigation infrastructure.
From our firsthand experience monitoring irrigations and helping growers troubleshoot issues, we’ve learned that flow rate data can sometimes reveal short-term or acute issues, like an open air vent or missing emitter, but they can also sometimes illuminate bigger or longer-term issues with pumps, pressure tanks, and other irrigation infrastructure.
Without accurate flow rate data, a grower might have to wait for something to fully blow out or break down to know there’s an issue. But in many instances, there might have been early warning signs in their flow data: sudden drop offs, big spikes up and down, or a gradual decline in flow over time.
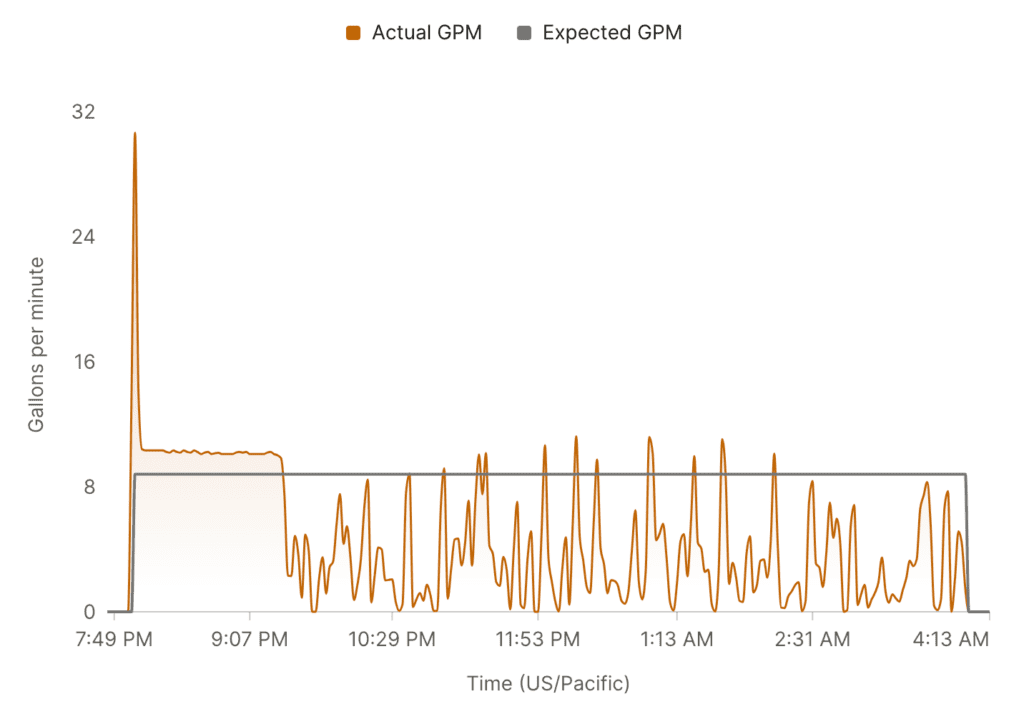
The data above shows the flow rate data fluctuating, which upon further investigation turned out to be a malfunctioning pump.
Armed with good data, growers have the chance to spot issues early and engage in preventative maintenance, reducing costs and avoiding big breakdowns at inconvenient times. (It’s always at the worst time, isn’t it?)
4. Comply with any usage regulations or reporting requirements.
As more and more communities begin to feel the effects of water scarcity, new regulations of one kind or another will inevitably come.
Growers who are tracking their water usage will have less to worry about because they’ll already have a good sense of their actual water need and they’ll be able to easily report their usage without having to scramble to implement any new technology.
To better manage our water resources, we need to better measure our usage. As better management becomes a higher and higher priority, those who are already tracking their usage will be ahead of the game.
5. Learn from previous seasons and historical irrigation flow rate data.
Tracking flow data and maintaining a historical log of past irrigations will enable curious viticulturalists to learn more about how their irrigations are impacting crop quality and yield.
In the Ops Center, Lumo users are able to access data from periods in the past and see exactly how much they irrigated that season, or before that big heat wave, and so on.
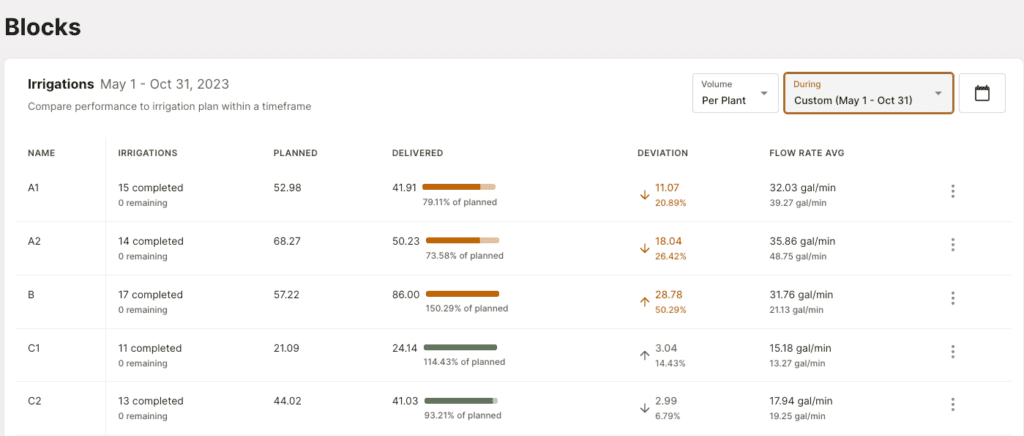
The table above shows a summary of block level irrigations and how much water was actually delivered compared to the expected amount
Having that data in a structured, easily digestible format will give viticulturalists a more complete picture of their inputs and one more tool to improve their craft.
Why Accurately Tracking Flow Rate Data is Essential
Irrigation flow rate data helps farmers irrigate with precision, catch faults automatically, prevent bigger issues with their irrigation infrastructure, easily comply with any new government regulations on reporting or usage, and create a historical log to better learn from past seasons.
Water is an essential input for growing great grapes. Measuring and monitoring your water usage is an essential step toward growing even better ones more sustainably.
To learn more about how you can easily and accurately track irrigation flow rate data, request a demo here or contact us at [email protected]